Monitor Indexes
The Indexes screen in Couchbase Web Console enables you to see statistics for a specific primary index or global secondary index. It also enables you to see resource usage for the Index Service across all nodes.
Index Statistics
To display statistics for a specific index:
-
Click the Indexes link in the navigation bar to display the Indexes screen.
-
Click an index row in the list of indexes to expand the index row.
-
Click the Index Stats heading in the expanded index row.
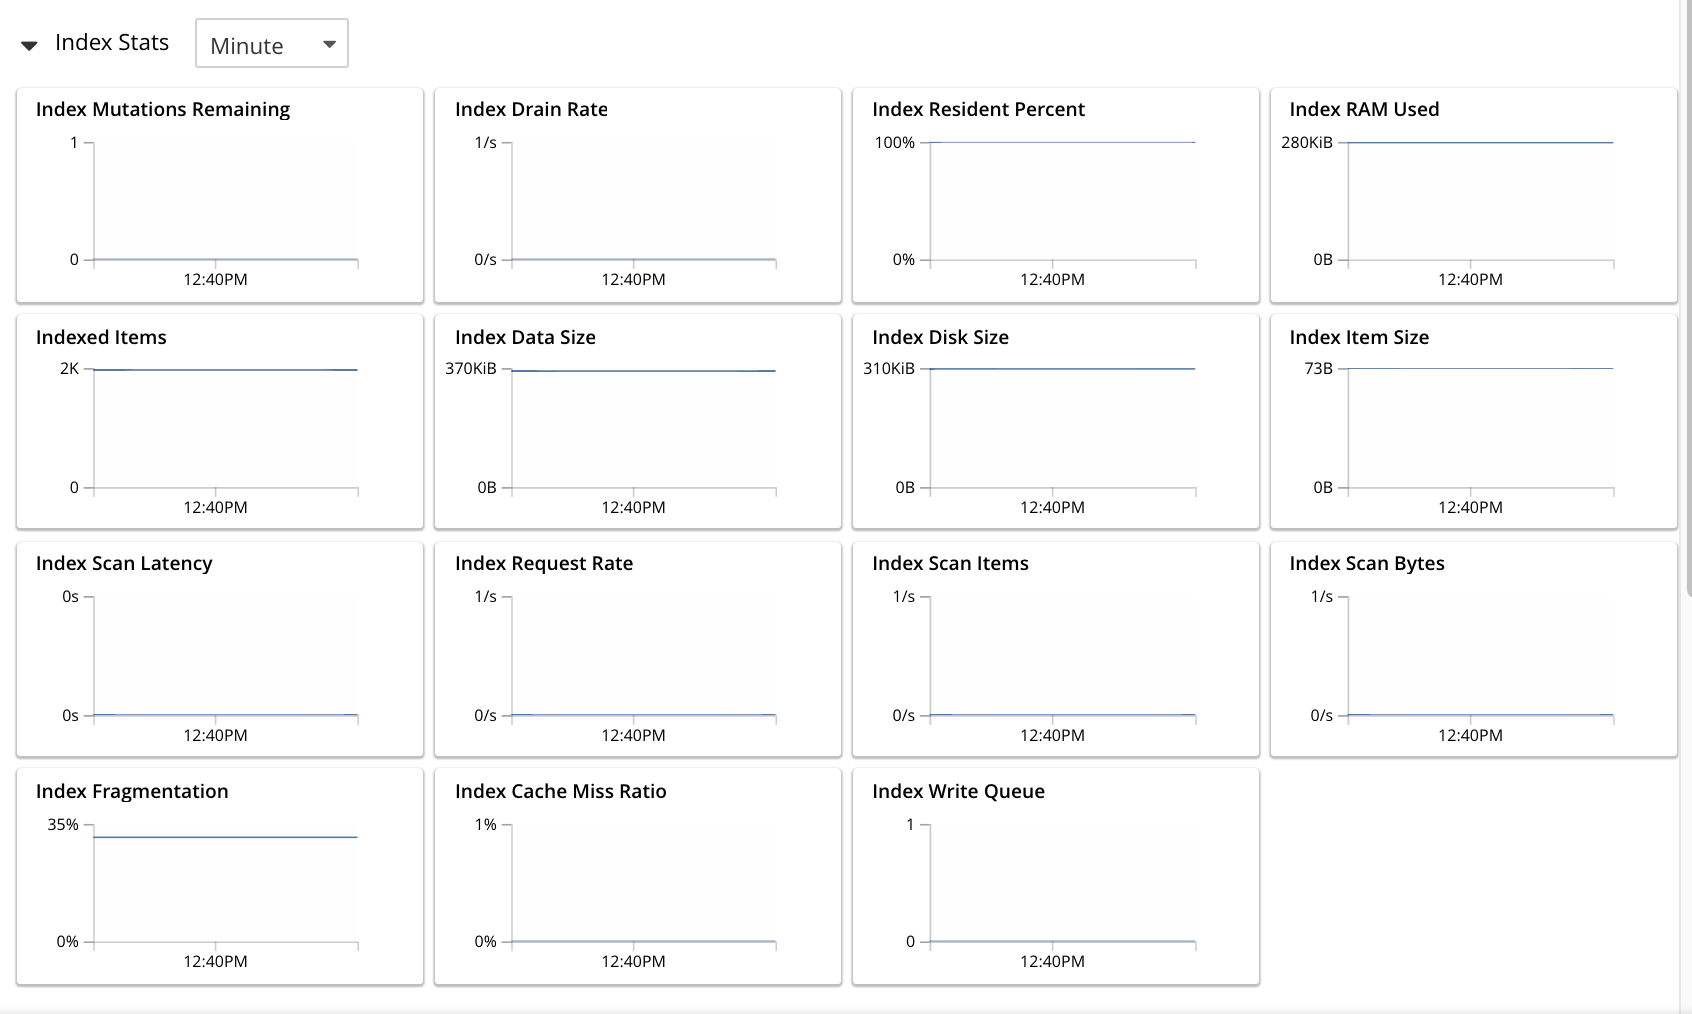
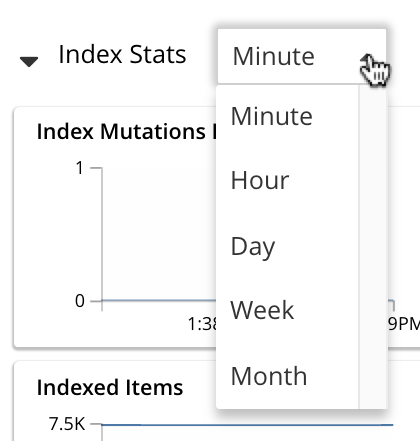
A graphical display of statistics for the index is shown.

The displayed charts are as follows:
-
Index Mutations Remaining. The number of documents pending to be indexed.
-
Index Drain Rate. The average number of items flushed from memory to disk storage per second.
-
Index Resident Percent. The percentage of the data held in memory.
-
Index RAM Used. The total memory consumed by the index.
-
Indexed Items. The number of items currently indexed.
-
Index Data Size. The size of indexable data that is maintained for the index.
-
Index Disk Size. The total disk file size consumed by the index.
-
Index Item Size. The average size of each index item.
-
Index Scan Latency. The average time to serve a scan request.
-
Index Request Rate. The number of requests served by the indexer per second.
-
Index Scan Items. The number of index items scanned by the indexer per second.
-
Index Scan Bytes. The number of bytes read by a scan per second.
-
Index Fragmentation. The percentage fragmentation of the index. This indicates the percentage of disk space consumed by the index, but not utilized for items stored in the index. Note that at small index sizes of less than a hundred KBb, the static overhead of the index disk file will inflate the index fragmentation percentage.
-
Index Cache Miss Ratio. The percentage of accesses made to this index from disk, rather than from RAM.
-
Index Write Queue. The number of items waiting to be written.
Index-Service Statistics
The footer of the Indexes screen displays general statistics for the Index Service. These show resource usage for the Index Service across all nodes.

Note that the footer is always displayed: it does not scroll out of view.
The first three statistics (in the left column) apply to the Index Service as a whole. The other statistics (in the middle and right columns) apply to a single bucket. The selected bucket is displayed at the top right of the footer.
-
Index Service RAM Quota. The buffer cache size for the Index Service across all nodes.
-
RAM Used/Remaining. The amount of memory used by the Index Service, and the remaining amount of memory available to the Index Service.
-
Index Service RAM Percent. The amount of memory used by the Index Service, as a percentage of the amount of memory available to the Index Service.
-
Total Scan Rate. The number of index items scanned by the Index Service per second for the selected bucket.
-
Indexes Fragmentation. The percentage fragmentation of all indexes for the selected bucket. This indicates the percentage of disk space consumed by the indexes, but not utilized for items stored in the indexes.
-
Indexes Data Size. The actual data size consumed by all indexes for the selected bucket.
-
Indexes Disk Size. The total disk file size consumed by all indexes for the selected bucket.
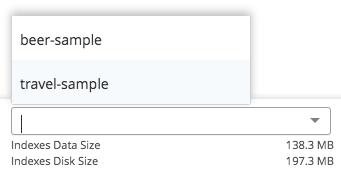
To display Index-Service statistics for a different bucket, open the drop-down list to the right of the Index-Service statistics:

To filter the list of buckets, type a filter term in the text box: nly buckets whose name contains the filter term are listed. Then, select the required bucket from the list.
Monitor Indexes with the CLI
You can monitor some Index-Service statistics using the CLI. Refer to server-info.
Note that there is no CLI support for statistics for a specific index.
Monitor Indexes with the REST API
You can monitor all Index-Service statistics, and statistics for a specific index, using the REST API. Refer to Index Statistics API.
